Our service & performance

At Curo, Trusted Customer Services is one of the five strategic objectives of our 10-year strategy. We monitor our performance so that customers know how we're doing.

You can read our annual reports and financial statements here. You'll also find on this page annual reports into gender equality, complaints and resident engagement.

How we're doing:

  • Jun 2026

    Here's the latest 'at-a-glance' summary of our performance at Curo. These regular performance snapshots look at how we're doing across some of the measurements customers have told us matter most.
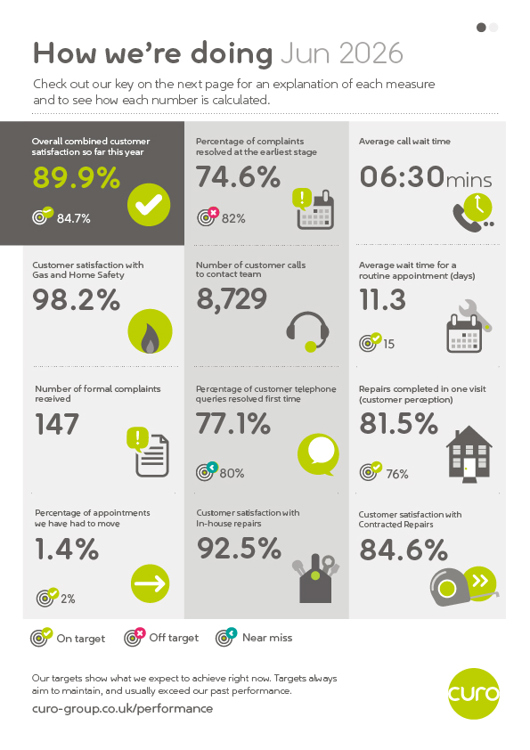
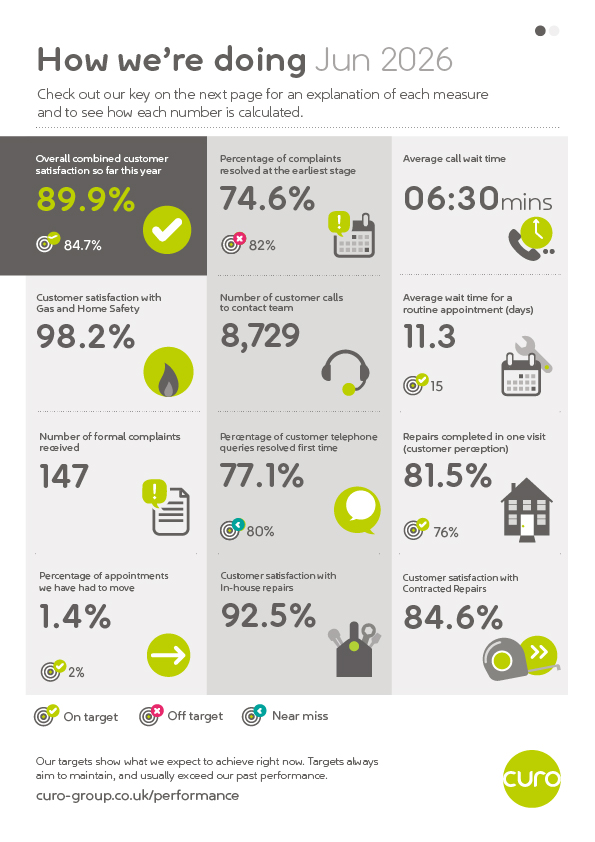
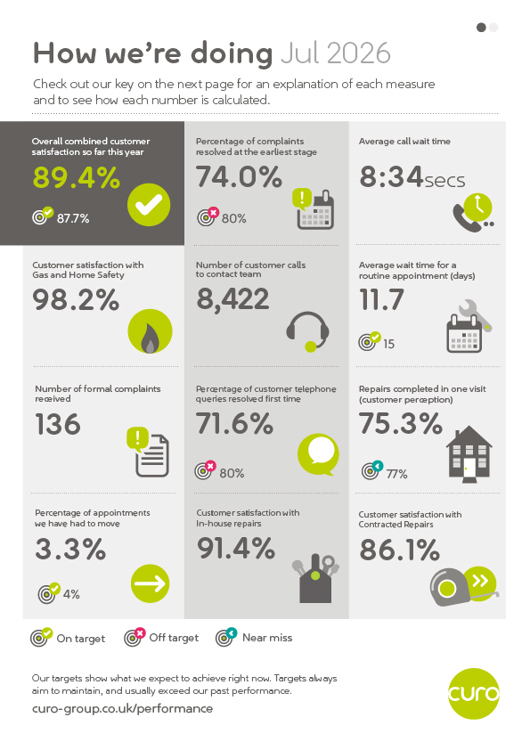
    Infographic titled “How we’re doing – Jun 2026” showing 12 customer service and repairs performance measures in a three-column grid. Key results include: overall combined customer satisfaction 89.9%; complaints resolved at the earliest stage 74.6%; average call wait time 6 minutes 30 seconds; customer satisfaction with Gas and Home Safe 98.2%; 8,729 customer calls; average wait for a routine appointment 11.3 days; 147 formal complaints; 77.1% of telephone queries resolved first time; 81.5% of repairs completed in one visit; 1.4% of appointments moved; 92.5% customer satisfaction with in-house repairs; and 84.6% customer satisfaction with contracted repairs. Each measure includes an icon and a target-status indicator showing whether performance is on target, off target or a near miss. A legend explains the status symbols, and the Curo logo appears at the bottom right.

    For a more in-depth look at our performance, check out our annual report here.

    If you'd like to help Curo shape our services and improve our performance, there are lots of ways to get involved here.

  • May 2026

    Here's the latest 'at-a-glance' summary of our performance at Curo. These regular performance snapshots look at how we're doing across some of the measurements customers have told us matter most.
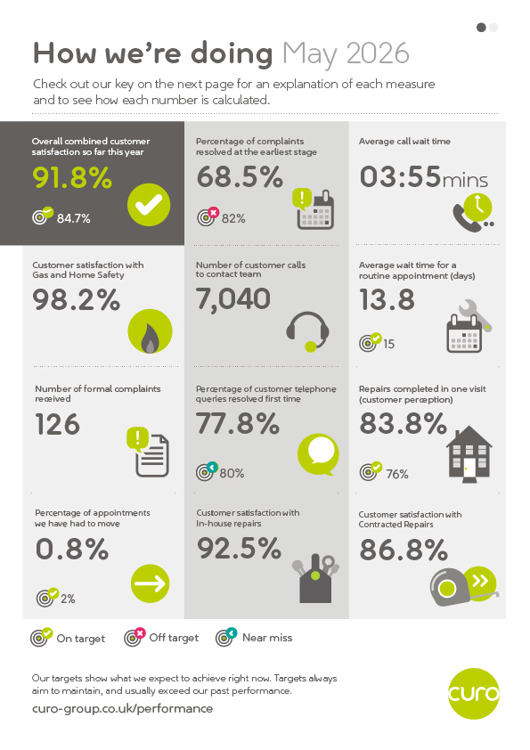
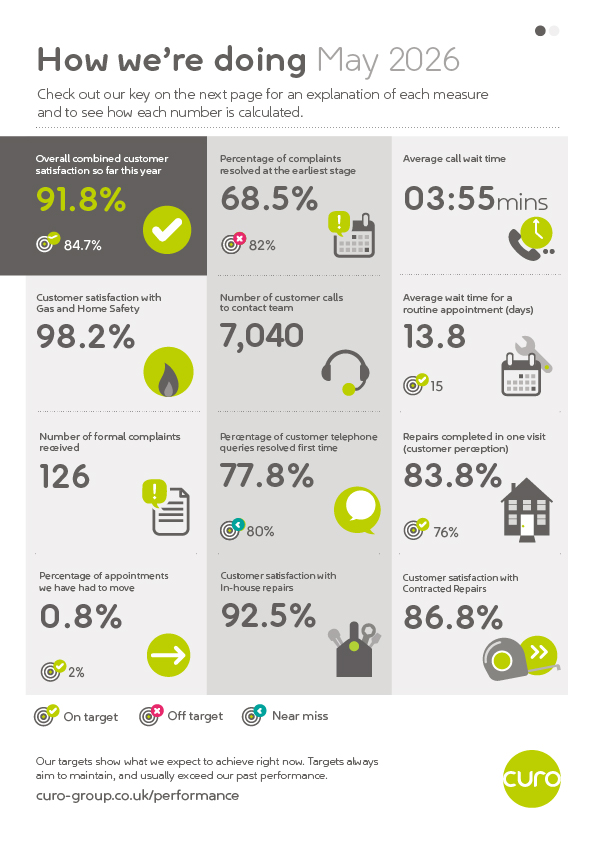
    Infographic titled “How we’re doing – May 2026” showing 12 customer service and repairs performance measures in a three-column grid. Key results include: overall combined customer satisfaction 91.8%; complaints resolved at the earliest stage 68.5%; average call wait time 3 minutes 55 seconds; customer satisfaction with Gas and Home Safe 98.2%; 7,040 customer calls; average wait for a routine appointment 13.8 days; 126 formal complaints; 77.8% of telephone queries resolved first time; 83.8% of repairs completed in one visit; 0.8% of appointments moved; 92.5% customer satisfaction with in-house repairs; and 86.8% customer satisfaction with contracted repairs. Each measure includes an icon and a target-status indicator showing whether performance is on target, off target or near miss. A legend explains the status symbols, and the Curo logo appears at the bottom right.

    For a more in-depth look at our performance, check out our annual report here.

    If you'd like to help Curo shape our services and improve our performance, there are lots of ways to get involved here.

  • April 2026

    Here's the latest 'at-a-glance' summary of our performance at Curo. These regular performance snapshots look at how we're doing across some of the measurements customers have told us matter most.
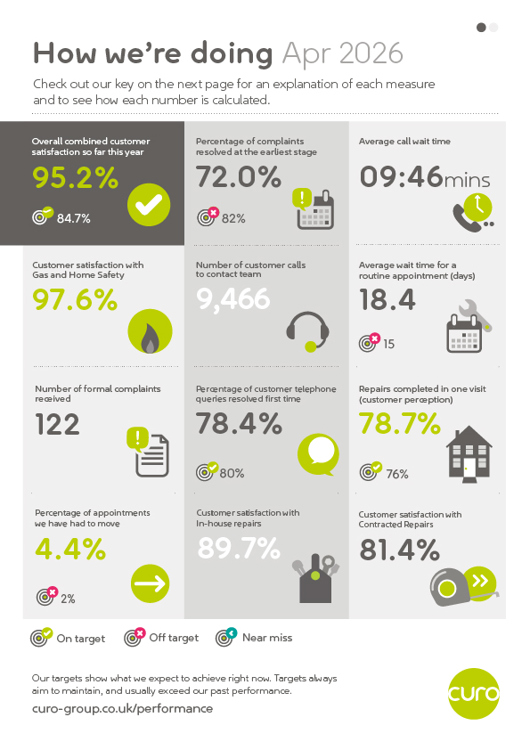
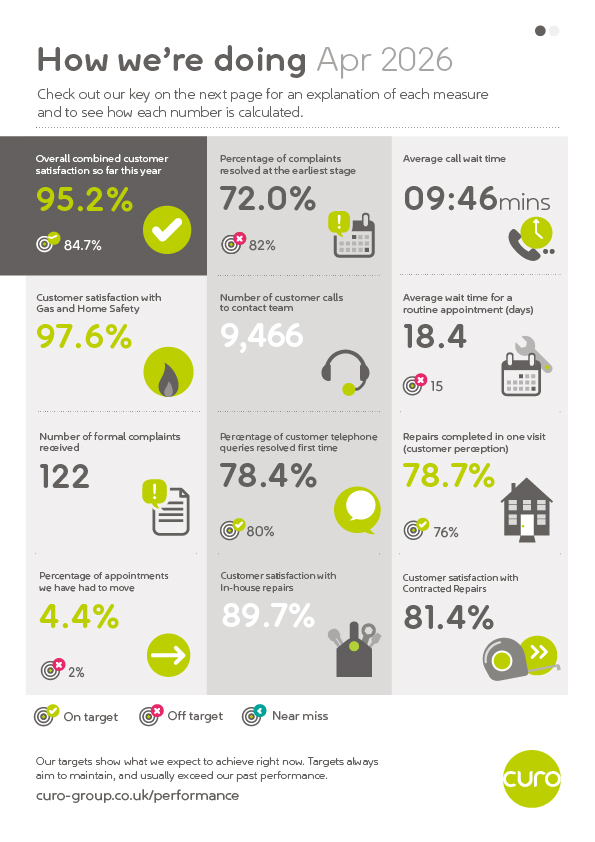
    Infographic titled “How we’re doing – Apr 2026” showing 12 customer service and repairs performance measures in a three-column grid. Key results include: overall combined customer satisfaction 95.2%; complaints resolved at the earliest stage 72.0%; average call wait time 9 minutes 46 seconds; customer satisfaction with Gas and Home Safety 97.6%; 9,466 customer calls; average wait for a routine appointment 18.4 days; 122 formal complaints; 78.4% of telephone queries resolved first time; 78.7% of repairs completed in one visit; 4.4% of appointments moved; 89.7% customer satisfaction with in-house repairs; and 81.4% customer satisfaction with contracted repairs. Each measure includes an icon and a target-status indicator showing whether performance is on target, off target or a near miss. A legend explains the status symbols, and the Curo logo appears at the bottom right.

    For a more in-depth look at our performance, check out our annual report here.

    If you'd like to help Curo shape our services and improve our performance, there are lots of ways to get involved here.

  • March 2026

    Here's the latest 'at-a-glance' summary of our performance at Curo. These regular performance snapshots look at how we're doing across some of the measurements customers have told us matter most.
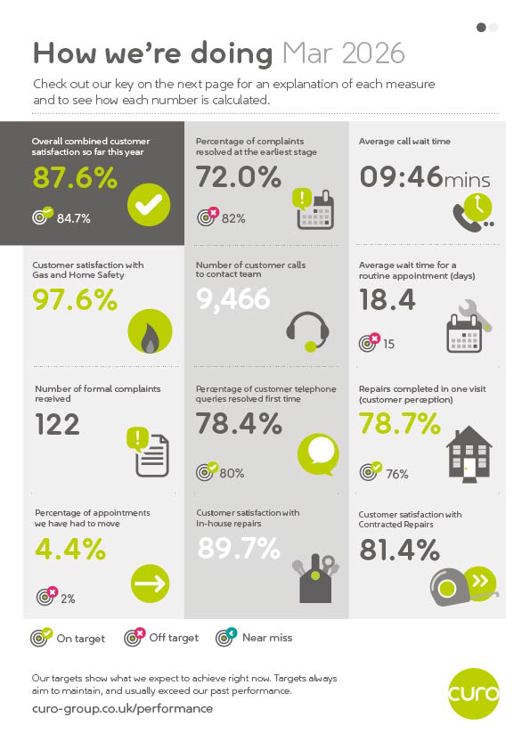
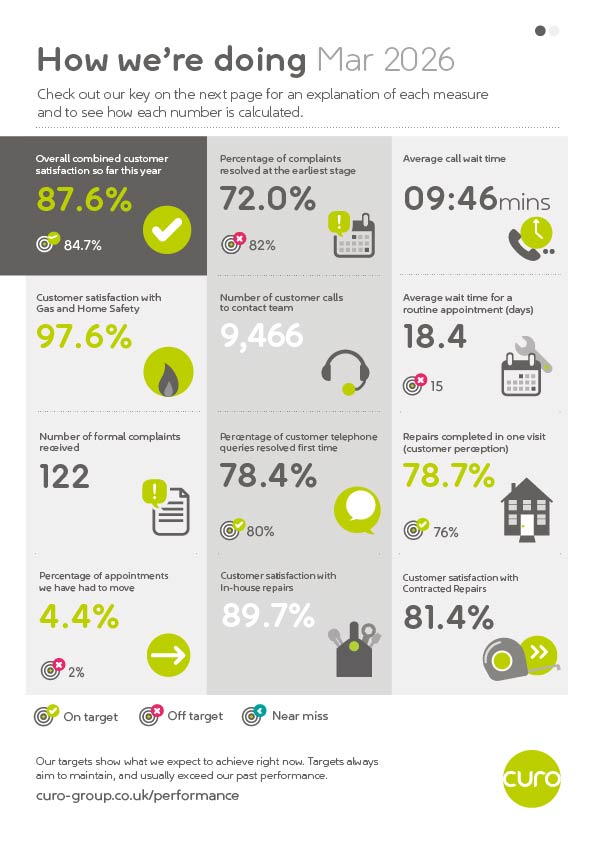
    Infographic titled “How we’re doing – Mar 2026” showing 12 customer service and repairs performance measures in a three-column grid. Key results include: overall combined customer satisfaction 87.6%; complaints resolved at the earliest stage 72.0%; average call wait time 9 minutes 46 seconds; customer satisfaction with Gas and Home Safety 97.6%; 9,466 customer calls; average wait for a routine appointment 18.4 days; 122 formal complaints; 78.4% of telephone queries resolved first time; 78.7% of repairs completed in one visit; 4.4% of appointments moved; 89.7% customer satisfaction with in-house repairs; and 81.4% customer satisfaction with contracted repairs. Each measure includes an icon and a target-status indicator showing whether performance is on target, off target or a near miss. A legend explains the status symbols, and the Curo logo appears at the bottom right.

    For a more in-depth look at our performance, check out our annual report here.

    If you'd like to help Curo shape our services and improve our performance, there are lots of ways to get involved here.

  • February 2026

    Here's the latest 'at-a-glance' summary of our performance at Curo. These regular performance snapshots look at how we're doing across some of the measurements customers have told us matter most.
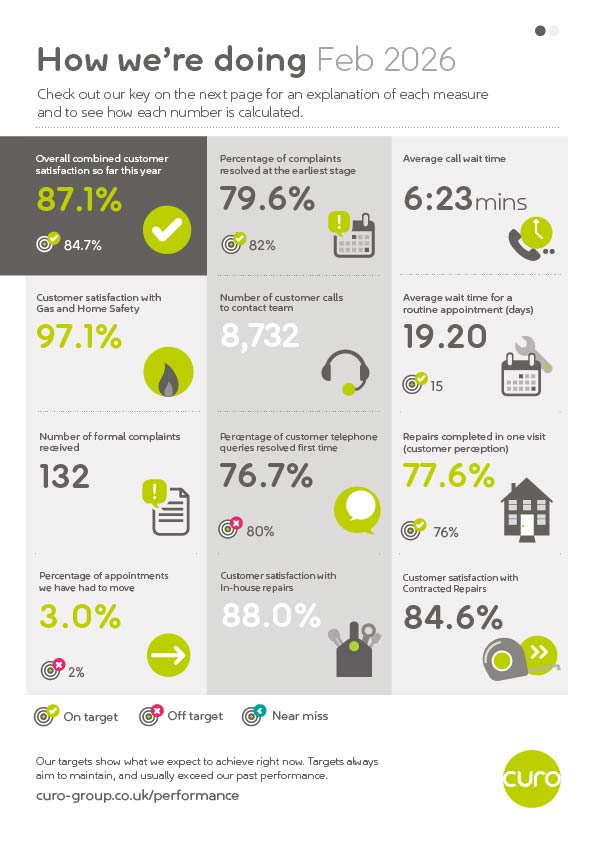
    Infographic titled “How we’re doing – Feb 2026” showing 12 customer service and repairs performance measures in a three-column grid. Key results include: overall combined customer satisfaction 87.1%; complaints resolved at the earliest stage 79.6%; average call wait time 6 minutes 23 seconds; customer satisfaction with Gas and Home Safety 97.1%; 8,732 customer calls; average wait for a routine appointment 19.20 days; 132 formal complaints; 76.7% of telephone queries resolved first time; 77.6% of repairs completed in one visit; 3.0% of appointments moved; 88.0% customer satisfaction with in-house repairs; and 84.6% customer satisfaction with contracted repairs. Each measure includes an icon and a target-status indicator showing whether performance is on target, off target or a near miss. A legend explains the status symbols, and the Curo logo appears at the bottom right.

    For a more in-depth look at our performance, check out our annual report here.

    If you'd like to help Curo shape our services and improve our performance, there are lots of ways to get involved here.

  • January 2026

    Here's the latest 'at-a-glance' summary of our performance at Curo. These regular performance snapshots look at how we're doing across some of the measurements customers have told us matter most.

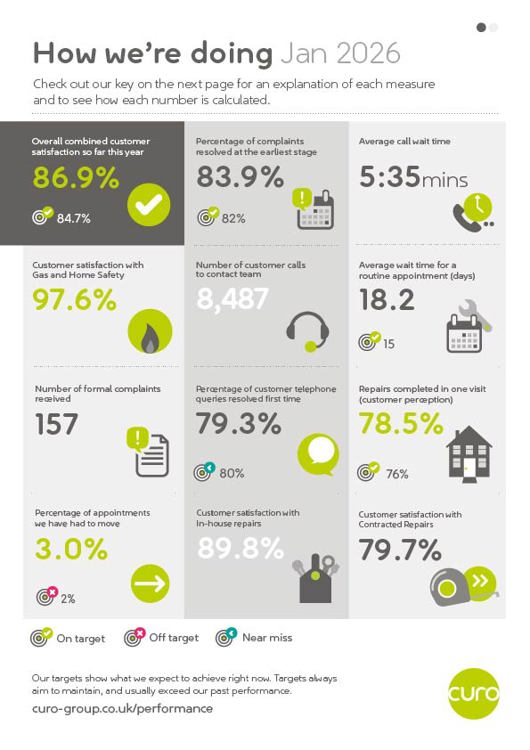
    Infographic titled “How we’re doing – Jan 2026” showing 12 customer service and repairs performance measures in a three-column grid. Key results include: overall combined customer satisfaction 86.9%; complaints resolved at the earliest stage 83.9%; average call wait time 5 minutes 35 seconds; customer satisfaction with Gas and Home Safety 97.6%; 8,487 customer calls; average wait for a routine appointment 18.5 days; 157 formal complaints; 79.3% of telephone queries resolved first time; 78.5% of repairs completed in one visit; 3.0% of appointments moved; 89.8% customer satisfaction with in-house repairs; and 79.7% customer satisfaction with contracted repairs. Each measure includes an icon and a target-status indicator showing whether performance is on target, off target or a near miss. A legend explains the status symbols, and the Curo logo appears at the bottom right.

    For a more in-depth look at our performance, check out our annual report here.

    If you'd like to help Curo shape our services and improve our performance, there are lots of ways to get involved here.

  • December 2025

    Here's the latest 'at-a-glance' summary of our performance at Curo. These regular performance snapshots look at how we're doing across some of the measurements customers have told us matter most.

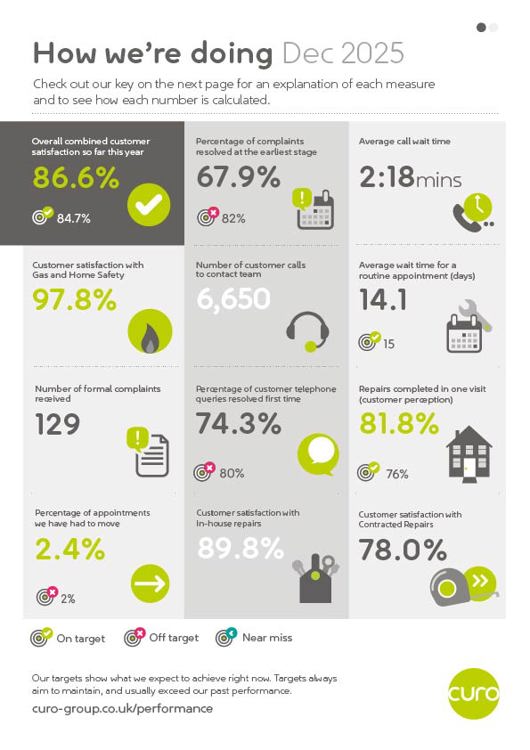
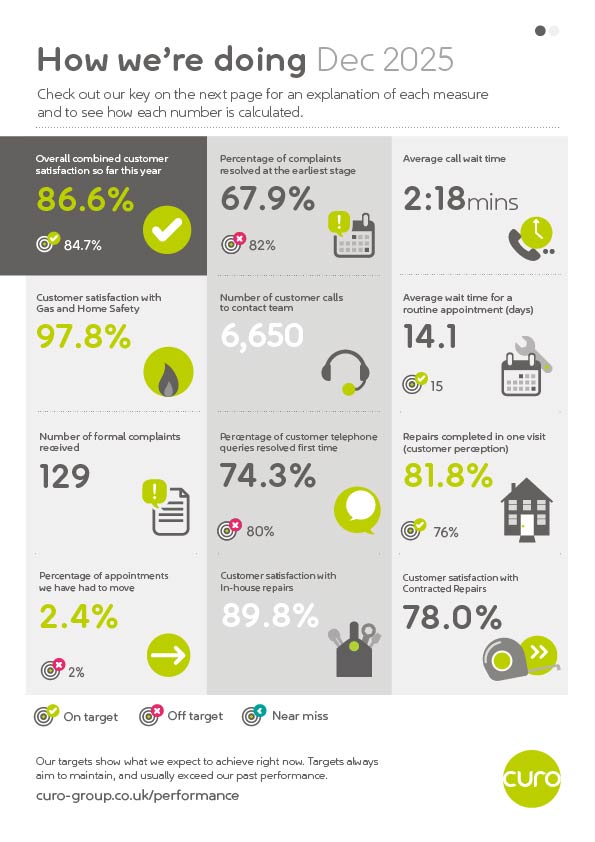
    Infographic titled “How we’re doing – Dec 2025” showing 12 customer service and repairs performance measures in a three-column grid. Key results include: overall combined customer satisfaction 86.6%; complaints resolved at the earliest stage 67.9%; average call wait time 2 minutes 18 seconds; customer satisfaction with Gas and Home Safety 97.8%; 6,650 customer calls; average wait for a routine appointment 14.1 days; 129 formal complaints; 74.3% of telephone queries resolved first time; 81.8% of repairs completed in one visit; 2.4% of appointments moved; 89.8% customer satisfaction with in-house repairs; and 78.0% customer satisfaction with contracted repairs. Each measure includes an icon and a target-status indicator showing whether performance is on target, off target or a near miss. A legend explains the status symbols, and the Curo logo appears at the bottom right.

    For a more in-depth look at our performance, check out our annual report here.

    If you'd like to help Curo shape our services and improve our performance, there are lots of ways to get involved here.

  • November 2025

    Here's the latest 'at-a-glance' summary of our performance at Curo. These regular performance snapshots look at how we're doing across some of the measurements customers have told us matter most.
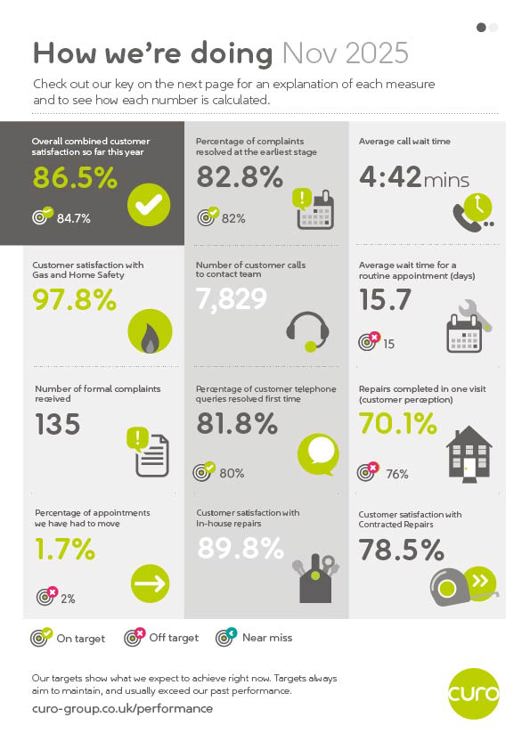
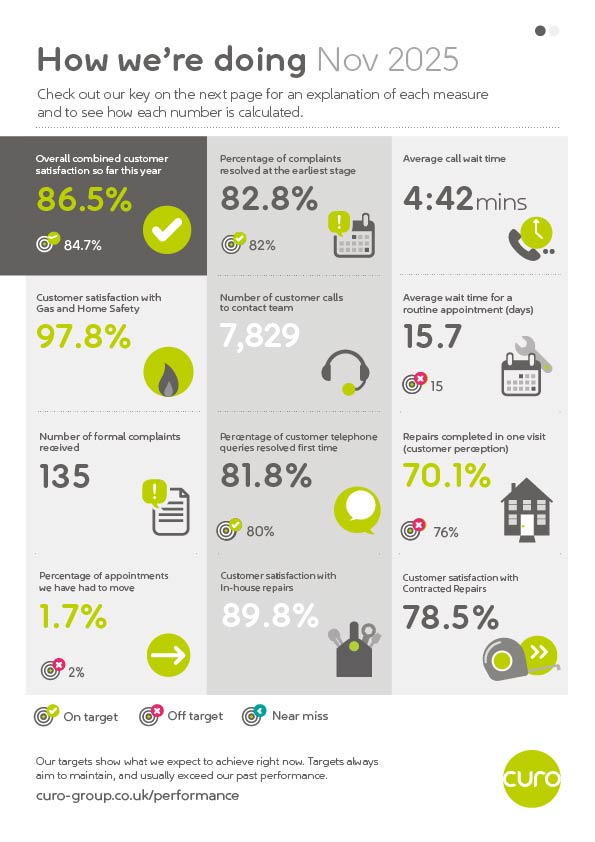
    Infographic titled “How we’re doing – Nov 2025” showing 12 customer service and repairs performance measures in a three-column grid. Key results include: overall combined customer satisfaction 86.5%; complaints resolved at the earliest stage 82.8%; average call wait time 4 minutes 42 seconds; customer satisfaction with Gas and Home Safety 97.8%; 7,829 customer calls; average wait for a routine appointment 15.7 days; 135 formal complaints; 81.8% of telephone queries resolved first time; 70.1% of repairs completed in one visit; 1.7% of appointments moved; 89.8% customer satisfaction with in-house repairs; and 78.5% customer satisfaction with contracted repairs. Each measure includes an icon and a target-status indicator showing whether performance is on target, off target or a near miss. A legend explains the status symbols, and the Curo logo appears at the bottom right.  Provide your feedback on BizChat

    For a moe in-depth look at our performance, check out our annual report here.

    If you'd like to help Curo shape our services and improve our performance, there are lots of ways to get involved here.

  • October 2025

    Here's the latest 'at-a-glance' summary of our performance at Curo. These regular performance snapshots look at how we're doing across some of the measurements customers have told us matter most.
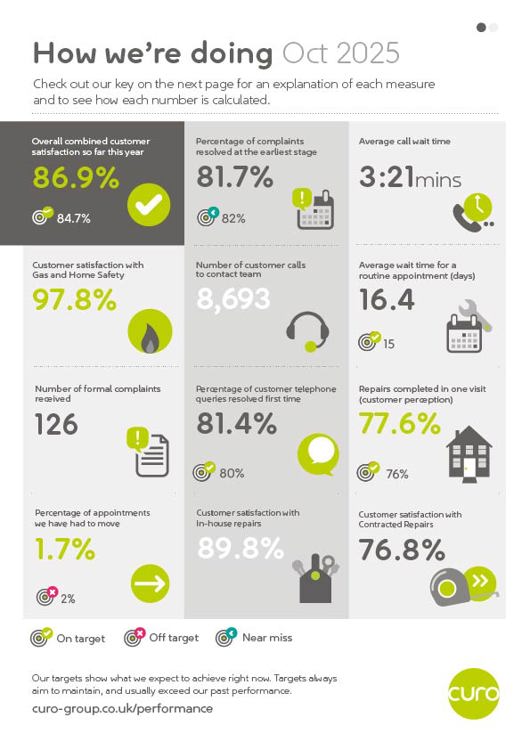
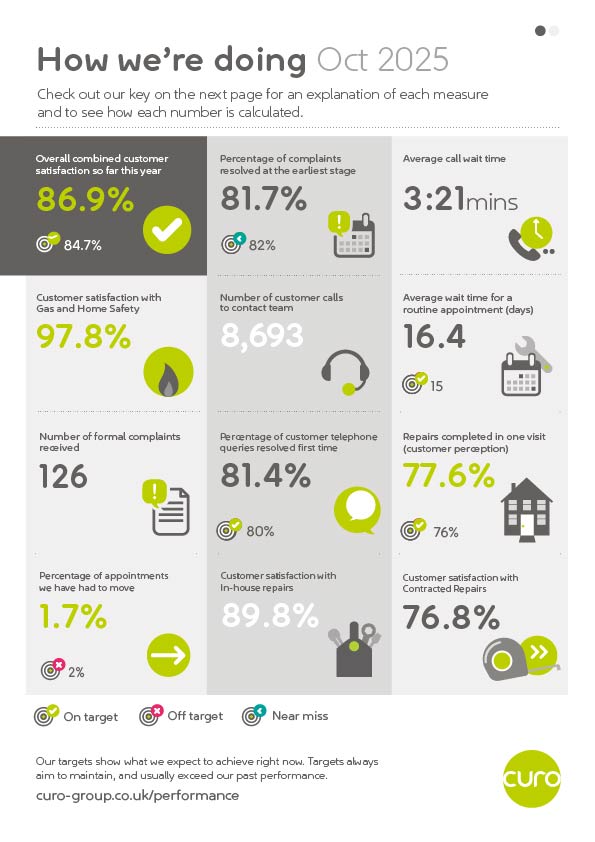
    Infographic titled “How we’re doing – Oct 2025” showing 12 customer service and repairs performance measures in a three-column grid. Key results include: overall combined customer satisfaction 86.9%; complaints resolved at the earliest stage 81.7%; average call wait time 3 minutes 21 seconds; customer satisfaction with Gas and Home Safety 97.8%; 8,693 customer calls; average wait for a routine appointment 16.4 days; 126 formal complaints; 81.4% of telephone queries resolved first time; 77.6% of repairs completed in one visit; 1.7% of appointments moved; 89.8% customer satisfaction with in-house repairs; and 76.8% customer satisfaction with contracted repairs. Each measure includes an icon and a target-status indicator showing whether performance is on target, off target or a near miss. A legend explains the status symbols, and the Curo logo appears at the bottom right.

    For a more in-depth look at our performance, check out our annual report here.

    If you'd like to help Curo shape our services and improve our performance, there are lots of ways to get involved here.

  • September 2025

    Here's the latest 'at-a-glance' summary of our performance at Curo. These regular performance snapshots look at how we're doing across some of the measurements customers have told us matter most.
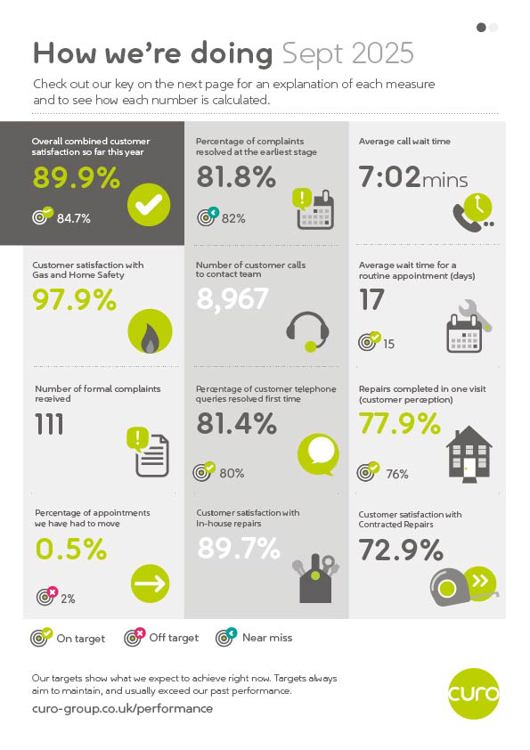
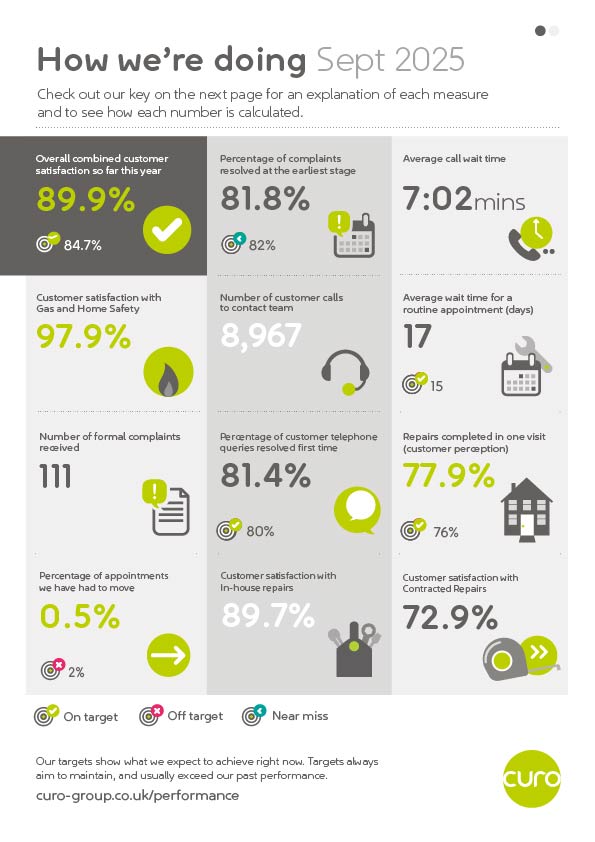
     Infographic titled “How we’re doing – Sept 2025” showing 12 customer service and repairs performance measures in a three-column grid. Key results include: overall combined customer satisfaction 89.9%; complaints resolved at the earliest stage 81.8%; average call wait time 7 minutes 2 seconds; customer satisfaction with Gas and Home Safety 97.9%; 8,967 customer calls; average wait for a routine appointment 17 days; 111 formal complaints; 81.4% of telephone queries resolved first time; 77.9% of repairs completed in one visit; 0.5% of appointments moved; 89.7% customer satisfaction with in-house repairs; and 72.9% customer satisfaction with contracted repairs. Each measure includes an icon and a target-status indicator showing whether performance is on target, off target or a near miss. A legend explains the status symbols, and the Curo logo appears at the bottom right.

    For a more in-depth look at our performance, check out our annual report here.

    If you'd like to help Curo shape our services and improve our performance, there are lots of ways to get involved here.

  • August 2025

    Here's the latest 'at-a-glance' summary of our performance at Curo. These regular performance snapshots look at how we're doing across some of the measurements customers have told us matter most.
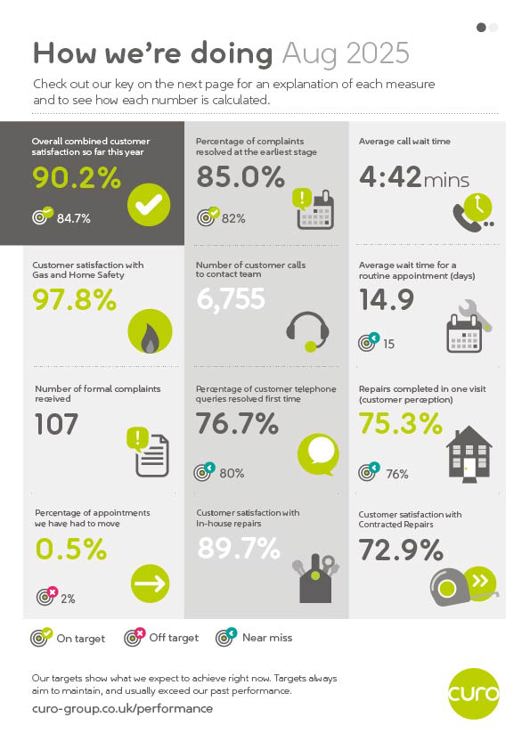
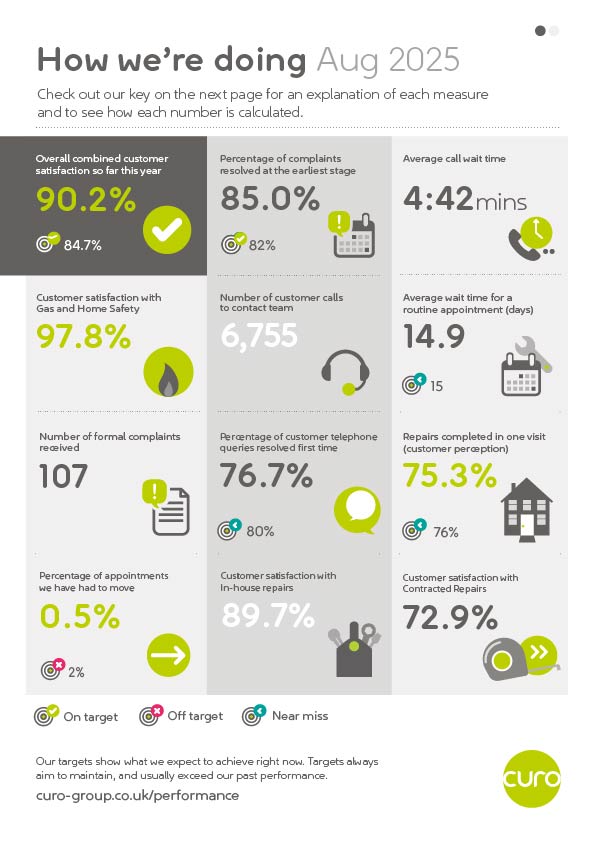
    Infographic titled “How we’re doing – Aug 2025” showing 12 customer service and repairs performance measures in a three-column grid. Key results include: overall combined customer satisfaction 90.2%; complaints resolved at the earliest stage 85.0%; average call wait time 4 minutes 42 seconds; customer satisfaction with Gas and Home Safety 97.8%; 6,755 customer calls; average wait for a routine appointment 14.9 days; 107 formal complaints; 76.7% of telephone queries resolved first time; 75.3% of repairs completed in one visit; 0.5% of appointments moved; 89.7% customer satisfaction with in-house repairs; and 72.9% customer satisfaction with contracted repairs. Each measure includes an icon and a target-status indicator showing whether performance is on target, off target or a near miss. A legend explains the status symbols, and the Curo logo appears at the bottom right.

    For a more in-depth look at our performance, check out our annual report here.

    If you'd like to help Curo shape our services and improve our performance, there are lots of ways to get involved here.

  • July 2025

    Here's the latest 'at-a-glance' summary of our performance at Curo. These regular performance snapshots look at how we're doing across some of the measurements customers have told us matter most.
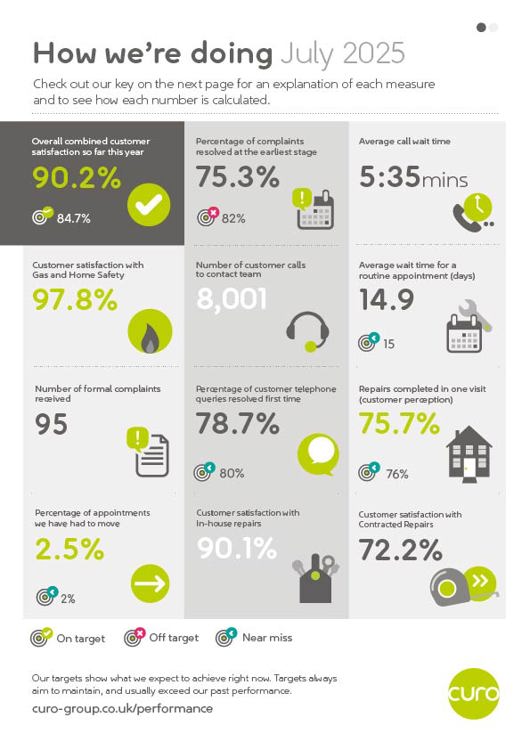
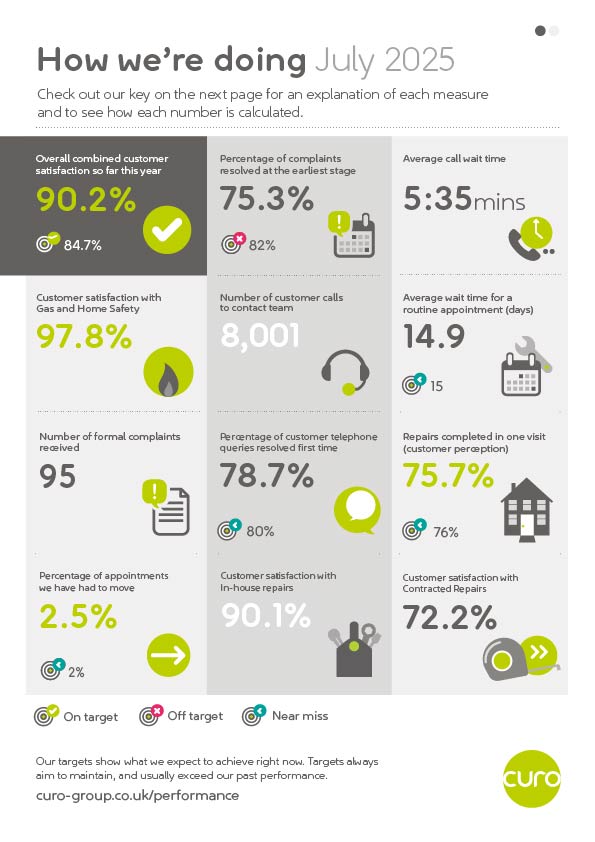
    Infographic titled “How we’re doing – July 2025” showing 12 customer service and repairs performance measures in a three-column grid. Key results include: overall combined customer satisfaction 90.2%; complaints resolved at the earliest stage 75.3%; average call wait time 5 minutes 35 seconds; customer satisfaction with Gas and Home Safety 97.8%; 8,001 customer calls; average wait for a routine appointment 14.9 days; 95 formal complaints; 78.7% of telephone queries resolved first time; 75.7% of repairs completed in one visit; 2.5% of appointments moved; 90.1% customer satisfaction with in-house repairs; and 72.2% customer satisfaction with contracted repairs. Each measure includes an icon and a target-status indicator showing whether performance is on target, off target or a near miss. A legend explains the status symbols, and the Curo logo appears at the bottom right.

    For a more in-depth look at our performance, check out our annual report here.

    If you'd like to help Curo shape our services and improve our performance, there are lots of ways to get involved here.

  • June 2025

    Here's the latest 'at-a-glance' summary of our performance at Curo. These regular performance snapshots look at how we're doing across some of the measurements customers have told us matter most.
    Infographic titled “How we’re doing – June 2025” showing 12 customer service and repairs performance measures in a three-column grid. Key results include: overall combined customer satisfaction 93.6%; complaints resolved at the earliest stage 81.2%; average call wait time 11 minutes 51 seconds; customer satisfaction with Gas and Home Safety 98.0%; 8,322 customer calls; average wait for a routine appointment 15.6 days; 99 formal complaints; 79.6% of telephone queries resolved first time; 71.1% of repairs completed in one visit; 1.6% of appointments moved; 89.8% customer satisfaction with in-house repairs; and 74.1% customer satisfaction with contracted repairs. Each measure includes an icon and a target-status indicator showing whether performance is on target, off target or a near miss. A legend explains the status symbols, and the Curo logo appears at the bottom right.

    For a more in-depth look at our performance, check out our annual report here.

    If you'd like to help Curo shape our services and improve our performance, there are lots of ways to get involved here.
Scrutiny

Curo's Oversight Group will commission up to four resident-led scrutiny groups each year to carry out reviews of specific Curo services. Find out more here.

Setting standards - our Customer Commitment

We developed our Customer Commitment with our customers. It sets our commitments and what we expect from them in return.

If you would like to get involved in developing and setting standards please contact us.

If you would like information on the specific standards we currently aim to achieve in delivering services to you please contact us.

Tell us how you think we are doing

We always welcome feedback from our customers - whether that's a compliment, a complaint, or an idea for how we could improve - we'd love to hear from you.

Help to shape our services

You can help to shape our services for the better - find out about the many ways you can get involved.

Useful links

Alternative formats

We can provide our documents in a range of different formats including:

  • Large print
  • Audio
  • Braille
  • Other languages
  • Sign language
  • Live interpretation

Please contact us if you'd like information in an alternative format. You can also find information about all of our accessible services here.